

Introduction
Learn why your apps crash and why you get complaints from users. Here is how to monitor your mobile apps with Firebase Crashlytics. Firebase Crashlytics is a light-weight solution to get insight about why your users get app crashes and exception messages. It is part of the Firebase cloud services, but can be used for free and supports mobile apps.
A dashboard shows you in detail your app metrics and allows inspecting reported crashes in detail. You get information about the exception, the exact line of code, and also the current stack trace at that time.
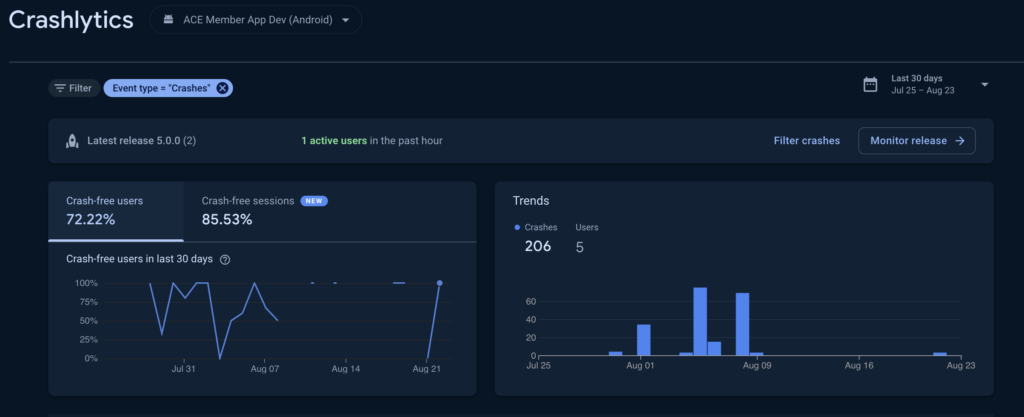
Here is a list of information that the dashboard provides
- Crash trends
- List of grouped issues
- Exception type and message, line of code, stack trace, log messages
- Device types, operating systems, timestamps, app version
The setup will take 10 minutes, so let’s get started right away and learn how to monitor your mobile apps with Firebase Crashlytics!
Firebase setup
The first steps are to create a Firebase account and to connect it with your Flutter app. I’ve published a detailed guide about this process. You can read it here.

To summarize it:
- Create a Firebase project
- Use the flutterfire CLI and firebase CLI to connect your Flutter app with Firebase
That’s it!
The flutterfire CLI creates the Firebase projects for your Android and iOS applications for you. You don’t have to do anything.
You can find your Crashlytics Dashboard in Firebase in the Run section. Currently, it’s empty. We will change that in the next steps.
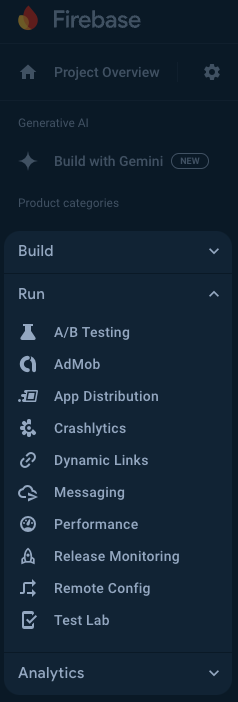
Let’s move on to the app code!
App setup
In this example, I will show you how to add Firebase Crashlytics to a Flutter app. If you are using a different programming language, check out the documentation. However, the steps are pretty similar.
Install the required packages in your app:
Not sure how this works? Read my instruction guide below:

Initialize Firebase in your main() method and connect Firebase Crashlytics with the default exception handlers of Flutter. Every time an unhandled exception is thrown, a error report will be uploaded to Firebase. Here is the code:
void main() async {
  WidgetsFlutterBinding.ensureInitialized();

  // connect to your Firebase project
  await Firebase.initializeApp(options: DefaultFirebaseOptions.currentPlatform);

  // handle unhandled exceptions of the Flutter framework
  FlutterError.onError = FirebaseCrashlytics.instance.recordFlutterFatalError;

  // handle all unhandled exception even outside the Flutter framework (sync and async)
  PlatformDispatcher.instance.onError = (dynamic error, StackTrace? stackTrace) {
      FirebaseCrashlytics.instance.recordFlutterFatalError(
          FlutterErrorDetails(exception: error, stack: stackTrace));
      return true;
  };

  runApp(const MyApp());
}By default, crash reports are uploaded automatically. You can disable this behavior with the following command:
FirebaseCrashlytics.instance.setCrashlyticsCollectionEnabled(false);It is recommended that you ask your users first if they agree that crash information is collected by a 3rd party system.
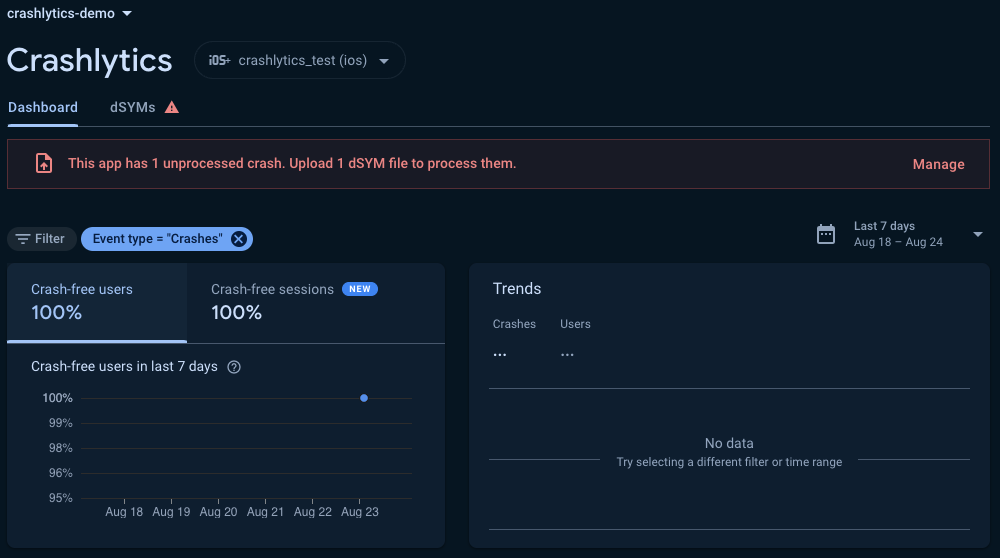
Upload iOS debug symbols
While Android apps work out of the box, iOS apps require an additional setup step. Firebase requires the debug symbols of your app to be uploaded, so that you can see report details. This is how your dashboard looks like when the symbols are missing:
By default, the flutterfire configure command should add this automatic upload. In case it doesn’t work or you make the connection with flutterfire, here are the steps to add the automation to your iOS project:
In your XCode project, go to Build Phases, and create a New Run Script Phase with the + button in the top left corner. Then, paste the following code:
PATH=${PATH}:$FLUTTER_ROOT/bin:$HOME/.pub-cache/bin
flutterfire upload-crashlytics-symbols --upload-symbols-script-path=$PODS_ROOT/FirebaseCrashlytics/upload-symbols --platform=ios --apple-project-path=${SRCROOT} --env-platform-name=${PLATFORM_NAME} --env-configuration=${CONFIGURATION} --env-project-dir=${PROJECT_DIR} --env-built-products-dir=${BUILT_PRODUCTS_DIR} --env-dwarf-dsym-folder-path=${DWARF_DSYM_FOLDER_PATH} --env-dwarf-dsym-file-name=${DWARF_DSYM_FILE_NAME} --env-infoplist-path=${INFOPLIST_PATH} --default-config=default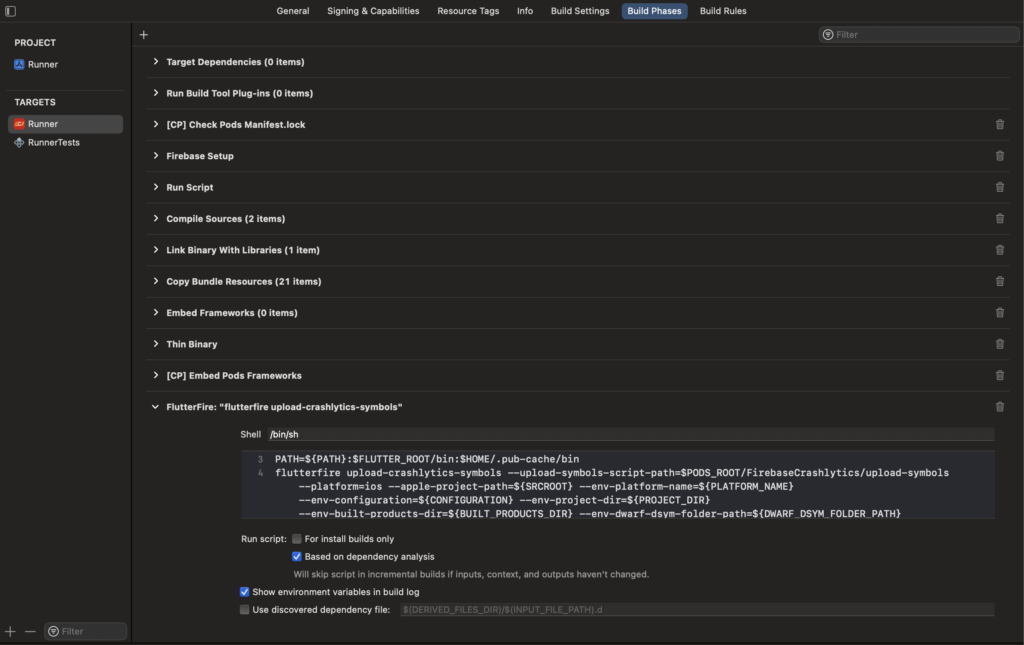
This will be executed after every iOS build and Firebase always receives the current debug symbols. From now on, the dashboard will show all details of any future crashes.
You can also just rerun the flutterfire configure command to solve this issue.
Report errors and crashes
You can either use the global exception handlers to catch and upload crash information to Firebase Crashlytics or you can trigger an error report yourself.
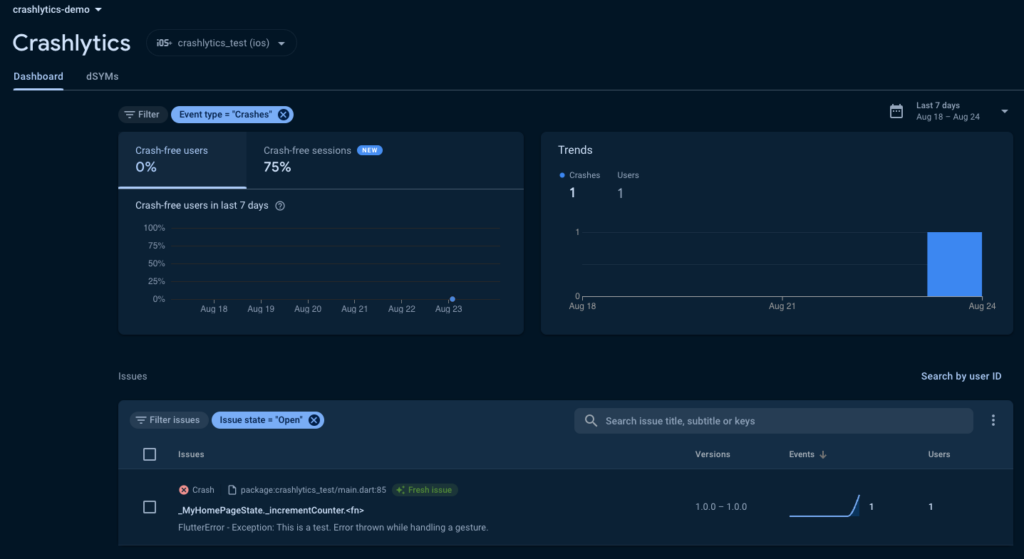
FirebaseCrashlytics.instance.recordError(Exception("Test"), StackTrace.current);Reports are sent to Firebase in regular intervals if data transmission is enabled. Sometimes, it can take a few minutes until the dashboard is updated. Here is an example dashboard with a recorded exception in an iOS app:
Logging
Firebase Crashlytics has a logging feature so that you can enhance your error reports with more information. Logs are collected until the next transmission to Firebase and appended to the report.
To create a log entry, use the following code:
FirebaseCrashlytics.instance.log("This is a log message");
throw Exception("this is another test with logs");<br>When you click on an issue in your dashboard, you get more detailed information including the logs. Here is how it looks:
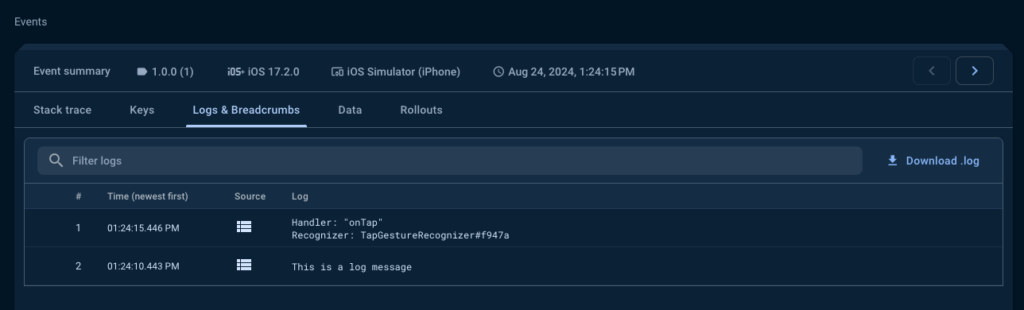
You cannot use the logs for local debugging since they are only visible alongside a report in Firebase. If you need logging for any other purpose, use a dedicated logging framework instead.
Conclusion
In this article, you learned how to monitor your mobile apps with Firebase Crashlytics. It’s an easy solution for iOS and Android to know why your apps crash. These insights are helpful to increase user satisfaction and decrease negative reviews for any app in production use.
Flutter ❤️ Firebase

Get started with Firebase and learn how to use it in your Flutter apps. My detailed ebook delivers you everything you need to know! Flutter and Firebase are a perfect match!
Related articles