

Introduction
People like charts. They are an easy way to display data. So here is how to create beautiful line charts in a Flutter app. This is perfect for any dashboard you want to build!
With line charts, you can visualize a variety of data. Think about daily sales of the last 30 days or accumulated revenues of the current year. It’s a perfect way to show users values that change over time. In this article, I want to show you how to create beautiful line charts in a Flutter app.
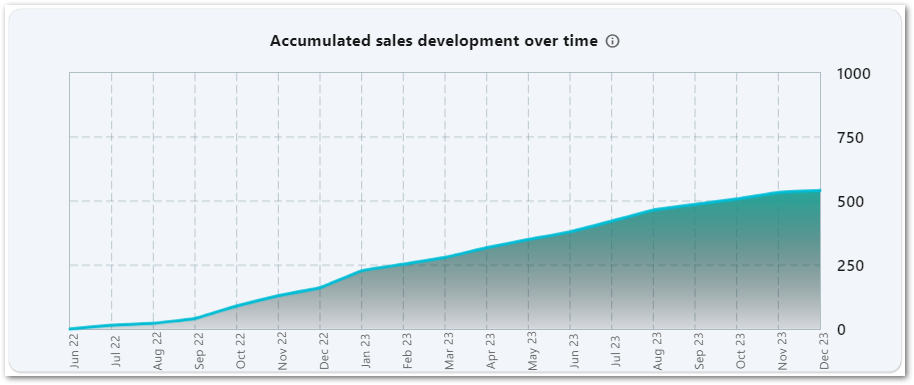
Eventually, this is what you can build:
Install the package
I use the package fl_chart.
Why? Because it’s the best I found so far.
It is actively developed (GitHub), supports multiple chart types, and has outstanding documentation with code examples. I can recommend it without exceptions.
No idea how to install a package in your Flutter app? Check out this article!
Provide chart data
Let’s start with the basic LineChart widget.
The data points are passed in with the spots property of the LineChartBarData object. A FlSpot object is just a 2-dimensional coordinate in a grid with an x and a y value. The chart uses those points to draw a line with the given settings of the LineChartBarData object. You can also pass multiple LineChartBarData objects which will result in multiple individual lines.
Click here for a description of all properties that you can use.
Generate axis descriptions
In my example, the bottom and the right axes contain custom descriptions. The bottom axis shows dates while the right axis shows a variety of numbers.
The chart can also auto-generate axes descriptions but it doesn’t work that well in my opinion. So here is my approach.
In general, you tell the widget how many axis descriptions you want to have with the interval property, what you want to display with the getTitlesWidget function, and how much space you want to reserve for the axis with the reservedSpace property.
Bottom axis
Here is the code for the bottom axis:
My chart uses one data point per month. This means, my spots property contains 19 objects with different x values. They look something like this
{
  0: 5,
  1: 15,
  2: 30,
  3: 50,
  4: 60,
  …,
  18: 540
}
Since my x values always increase by 1, I simply set the interval property to 1 and the chart generates an axis description at every data point with the getTitlesWidget function. If you want more lines, reduce the value and increase it for fewer lines.
The getTitlesWidget will be called at every interval providing the current index as the first argument. The function then translates the index into a month and year combination.
index is 0 ⇒ take the current date, subtract 19 months, and format the output to MMM yy
index is 1 ⇒ take the current date, subtract 18 months, and format the output to MMM yy
…
index is 19 ⇒ take the current date, subtract 0 months, and format the output to MMM yy
I omitted the code for the translation but I think you get the idea of what’s possible. If you just want to display the x coordinate, a simple getTitlesWidget: (val, meta) ⇒ Text(val.toString()) is enough.
Right axis
My right axis displays sale numbers with exactly 5 axis descriptions which adapt to whatever values are provided. Here is the code:
Notice the interval which is set to 0.25. This helps me to get exactly 5 axis descriptions. To achieve this, I set the maxY property of the LineChartData object to 1. Then, the chart will insert descriptions at the values of 0, 0.25, 0.5, 0.75, and 1. Of course, you can also use the original values and calculate with them. But the 0-1 interval feels easier to understand for me.
Since my chart adapts dynamically to the provided values, I created a function that calculates the axis descriptions based on the maximum value of the provided FlSpot objects.
When the max value is between 500 and 999, it will create description values of 0, 250, 500, 750, and 1000.
When the max value is between 250 and 499, it will create description values of 0, 125, 250, 375, and 500.
I think you get the idea ?
But for this to work, I needed to scale all y-values to the interval between 0 and 1. With the previous data object, the following y-values would be calculated:
// divide all values by the max axis value (1000 in this case)
{
  0: 0.005, // (5/1000)
  1: 0.015, // (15/1000)
  2: 0.030, // (30/1000)
  3: 0.050, // (50/1000)
  4: 0.060, // (60/1000),
  …,
  18: 0.540 // (540/1000)
}
Again, this is a rather complex use case to showcase the power of the widget.
Find out more about customizing axis descriptions in the official documentation.
Disable axis titles
To disable axis titles, use the following code:
Want More Flutter Content?

Join my bi-weekly newsletter that delivers small Flutter portions right in your inbox. A title, an abstract, a link, and you decide if you want to dive in!
Customize tooltips
Tooltips are also not that difficult to create. The LineTouchData object has a touchTooltipData property which contains a getTooltipItems function.
The function contains all spots of all chart lines at the current position. In my example, I just grab the current axis description of that spot alongside the value and place them underneath each other.

Read more about customizing tooltips in the documentation here.
Draw grid lines
Drawing grid lines is pretty easy. You specify the horizontal and vertical intervals and handle the getDrawingVerticalLine and getDrawingHorizontalLine functions. By default, you get a dashed line like in the screenshots above but you can also customize the FlLine object to your liking.
In my example, I go with the default settings and just define the intervals so that the grid matches the axis descriptions.
Here is more information about drawing grid lines in charts:
Examples
For more examples, check out these code snippets.
Conclusion
In this article, I showed you how to create beautiful line charts in a Flutter app. With the powerful package fl_chart, it’s really easy to create custom data visualizations and enhance your apps.
Related articles